
In our previous article, we described an AI agent that drafts regulatory investment documents for an energy network, and the stages that make its drafts worth trusting. This article covers the other half of the work, which was proving that each change to the agent actually made the drafts better. It builds on two themes we have written about before, code that passes every check and is still wrong in "Almost Right", and choosing what to measure in "Metrics for AI projects".
Write down what good looks like
Once the first version was running, and before we went much further, we wrote a specification of what the drafting agent should do and what good looks like at each stage. It set out which sources are authoritative for which kinds of fact, what the agent must never change, how a gap in the evidence should be reported, and what the finished document has to achieve for its reader.
From that we built a ladder of quality levels that any draft can be placed on:
At the bottom, the template's structure is filled but the prose could describe any project.
One level up, the draft is specific to its project, but some figures cannot yet be trusted or some required parts are unanswered.
Above that, every claim traces to evidence and every required section is answered.
Higher still, every figure comes from the authoritative source for its type and the prose speaks in the regulator's terms.
The top two levels, sign-off and submission, belong to people, and no score can award them.
Each draft is scored mainly on two measures, fidelity to the evidence and coverage of what the template asks, and it sits at the level its weaker measure reaches. That rule matters more than it might seem, because it means a fluent draft with one invented figure can never outrank an honest draft that says plainly what it could not find. A third check, on whether the prose uses the regulator's own terms, decides the higher levels, and the next section explains how each of these is measured.
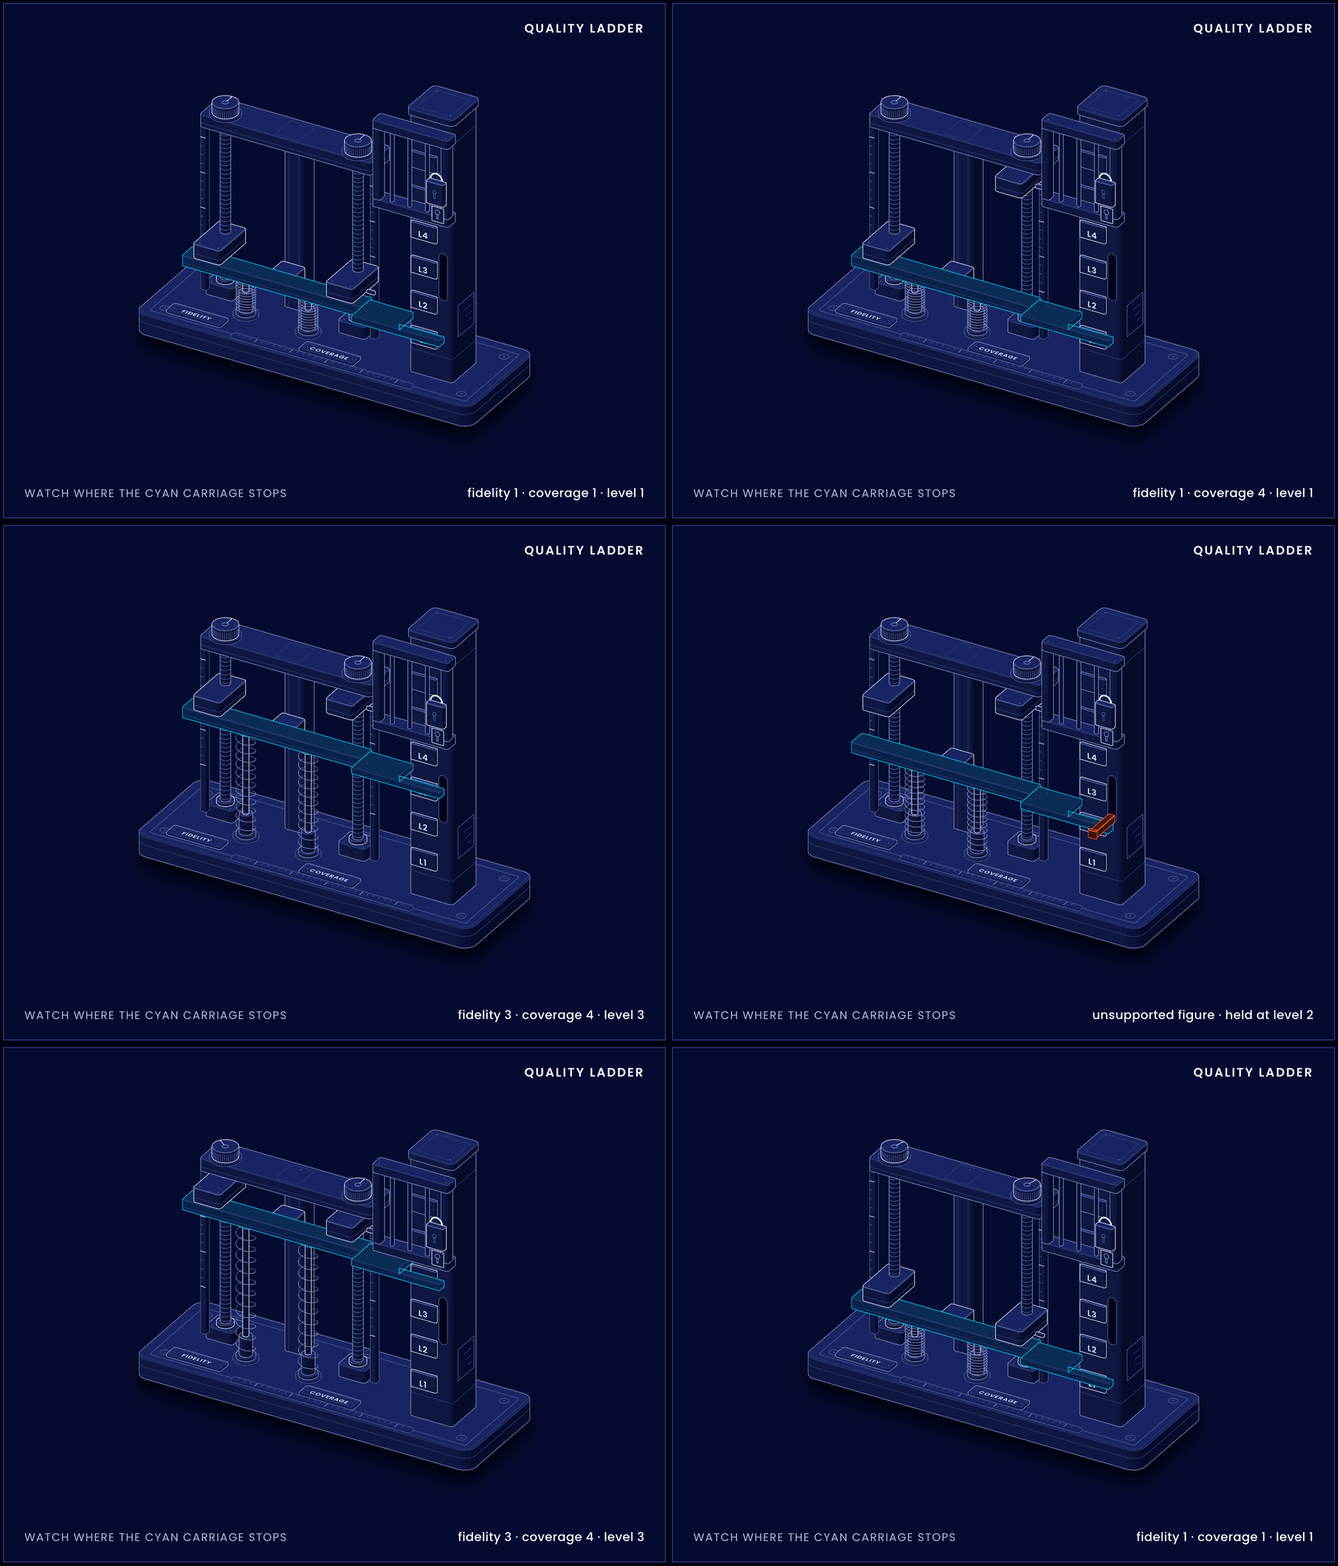
Figure 1. The quality ladder. Fidelity and coverage each raise their own carriage, and the draft can rise only as far as the lower of the two. The top two levels are locked because only people can award them, and an unsupported figure holds the draft down whatever else it achieves.
Measure every run
Every run of the agent writes a record of itself, kept as a structured file beside the draft. It holds what was run, meaning the code version, the project, the model and its settings and the documents it could search. It holds what each stage reported doing, alongside how much of that work the next stage received and used. It holds plain measurements of the finished document, such as its length, its tables, its marked gaps and any formatting left behind, and it holds the scores described below. Those records became our single source of truth, and a conclusion about whether a change helped had to be read from them rather than remembered or written up from impressions.
The scores come from a scorer that reads the finished draft rather than the agent's own account of it, and it assesses each draft in three ways.
Coverage
The template is turned into the list of questions each section has to answer, setting aside any that do not apply to the project, and the scorer marks each one as answered or not. The share left unanswered places the draft on the coverage side of the ladder, in bands at 30, 20 and 10 per cent. A required section with no real content, or a table with most of its cells empty, holds the draft down whatever the share.
Fidelity
Rules written in code check that every figure appears in the evidence the draft cites, that no two statements of the same quantity disagree, and that no figure presented as current comes from a superseded source. Each rule is absolute. A draft that breaks one cannot rise above the second level of the ladder however well the rest of it reads, because an average would let one wrong number hide behind good prose.
Defects
The authors' review comments were turned into a key of named defects, each with examples of what it looks like and what it does not, and every run is scored against that key. The key carries a version number, and when it changes every earlier run is scored again under the new version, so two runs are only ever compared under the same one.
Every score also comes with a list of what the scorer could not measure. Some qualities, such as keeping to one name for the organisation throughout, are not yet checked by code, and a draft is never credited with a level that depends on a check that did not run. That list is what stops a score from claiming more than it saw, and the sections that follow come back to it more than once.
Run it again
A single good draft proves very little, and the first thing the records taught us was humbling. We ran the same code on the same project three times and the drafts landed on different levels, with 9, 19 and 15 serious findings. Any change that moved the result by less than that spread could not be told apart from chance, however convincing a single run looked.
That changed what we were trying to fix. What mattered was how reliably the agent reached a good draft, because a person using it gets one run, not the best of three. From then on, at each important change to the code, we made three identical runs to measure how far the result moves on its own, and a change only counted as an improvement if it moved the result by more than that. Anything smaller was recorded as a direction rather than claimed as a result. Some spread always remains, because the model never gives exactly the same answer twice.
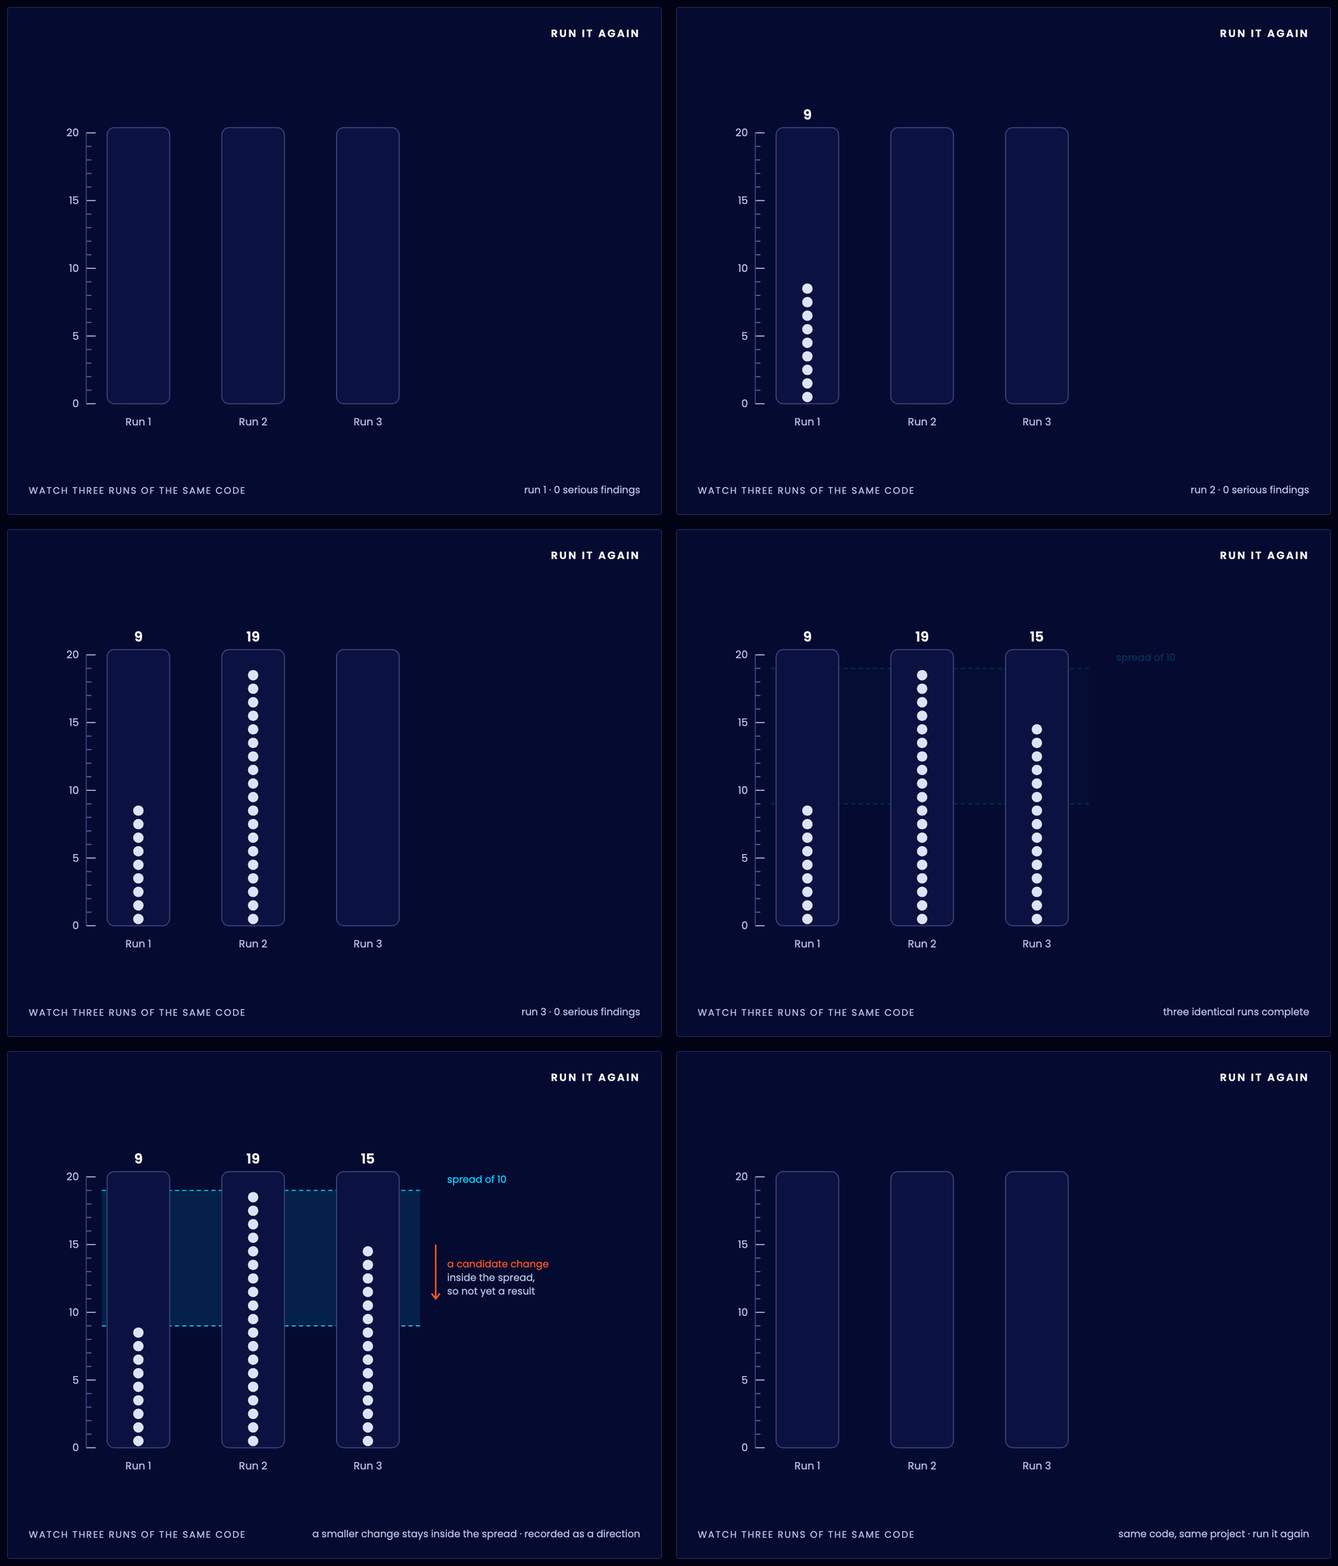
Figure 2. Three runs of identical code on the same project. Each column counts the serious findings in one run, and the shaded band is the spread a change has to beat before it counts as an improvement.
Measure the measurer
Some of our checks were themselves AI reviewers, and they can be wrong too. So we took thirty findings that an automated reviewer had marked as serious and asked people to label each one. Nine were real, nine were overstated and twelve were simply wrong. Only 30% held up, so we stopped steering by that measure and moved our attention to problems that people had confirmed.
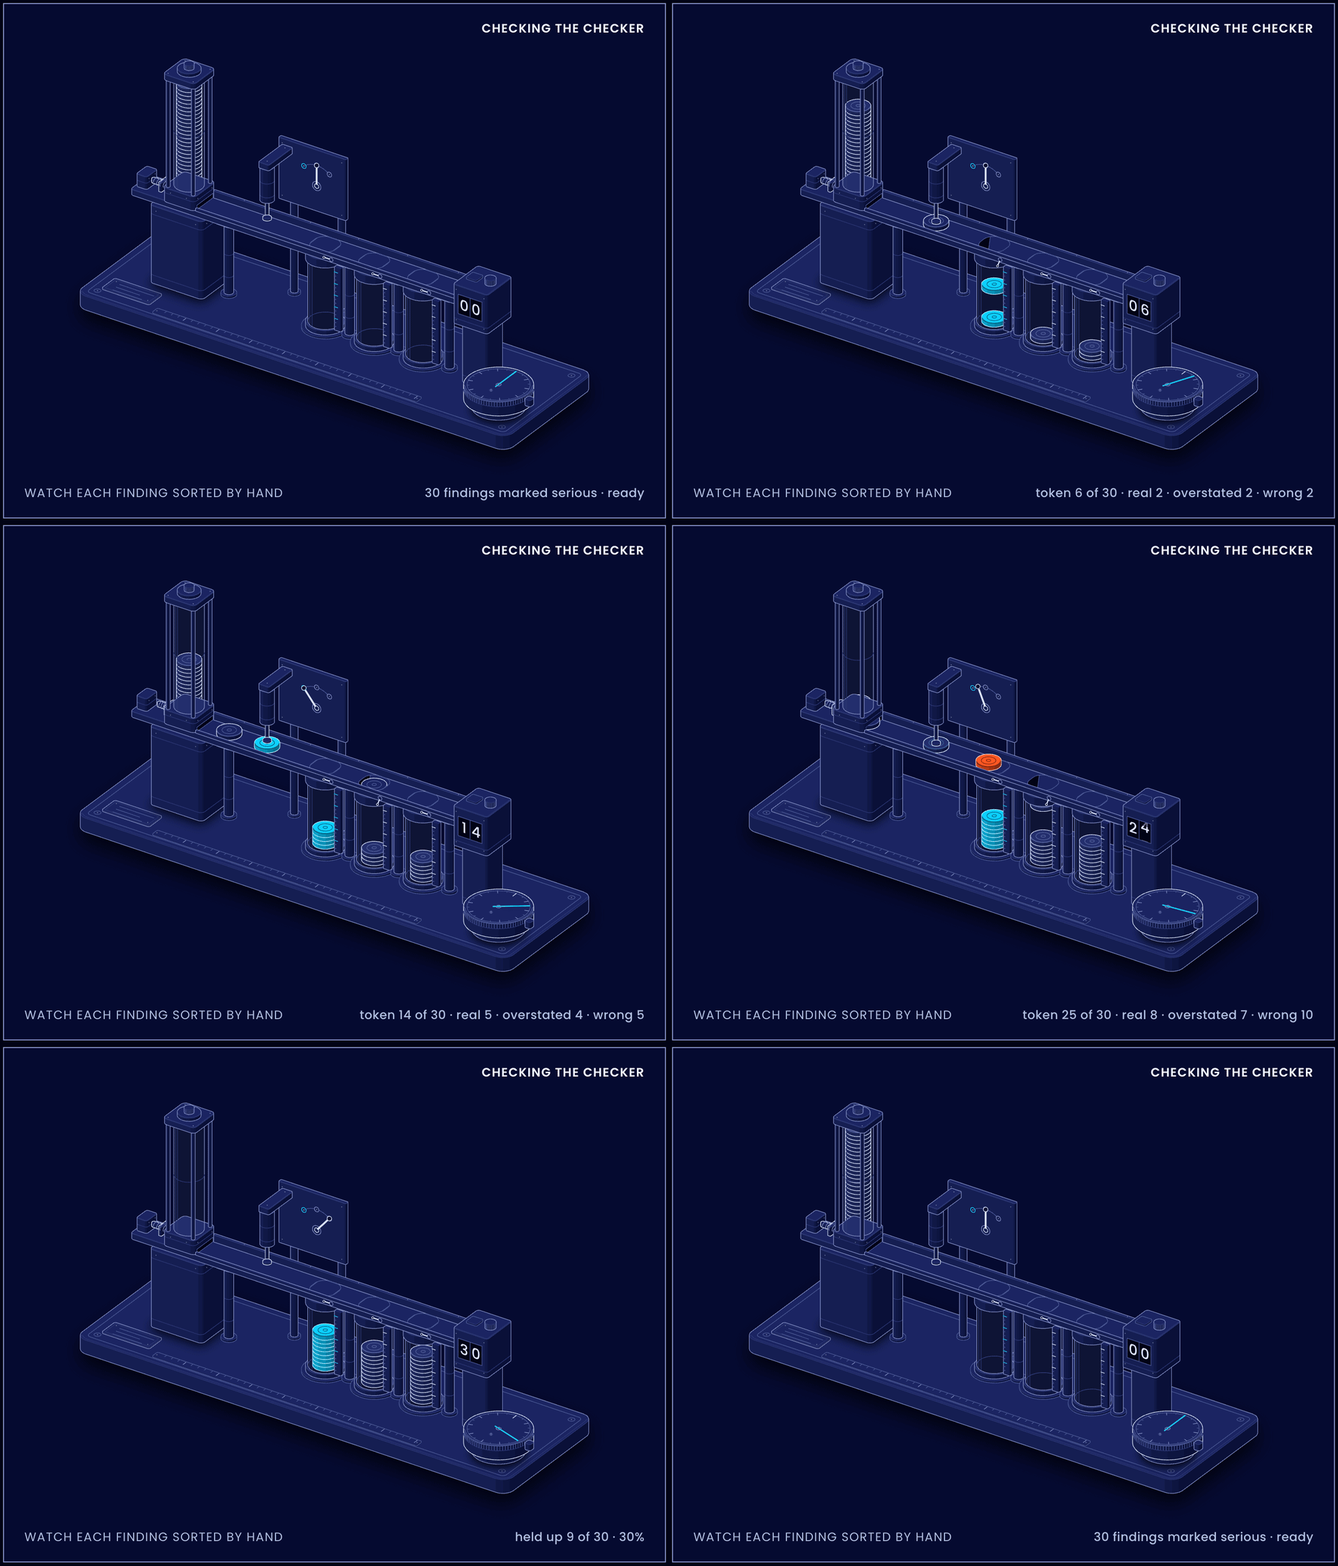
Figure 3. Thirty findings an automated reviewer marked as serious, sorted by hand into real, overstated and wrong. Only nine held up.
We found the same kind of trap in a rule-based check. Its count of disagreeing figures fell over several runs, which looked like progress, but the check was skipping any table cell that held more than one figure, and as the drafts improved, more cells held more than one. At one point it could read only 28 of 83 cells. Since then every count we report says how many items the check was able to see.
Check what reaches the reader
A stage that reports success has not shown that its work arrived. In one run the improvement stage reported that it had rewritten 21 sections, yet none of those rewrites, about 9,700 words in all, appeared in the Word document the author received, because the list of passages to write back into the document had been built before the improvements were made and was never rebuilt. Our first check missed it too, because it looked for the opening words of each passage and a rewrite usually keeps its first sentence. We now check the delivered document itself, sampling from the middle of each rewritten passage, rather than trusting any stage's account of what it did.
A worse result is a question, not a verdict
Some changes measured worse at first, and the useful habit was to find out why before deciding. When a long table is split into smaller pieces so that it can be searched, a piece can lose the header row that explains its numbers, so we repeated the header row in every piece. On the next run each piece was longer and the share of template questions left unanswered rose from 17.1% to 19.5%, which looked like a change to undo. Two runs later we found the real limit. Each piece of evidence was being cut to its first 600 characters before the writer saw it, so less than a third of the project's document text ever reached the model, and rows beneath a label in the cost workbooks were being dropped. Fixing those two faults took the unanswered share from 17.1% to 7.3%, and the header change stayed, because the cost tables cannot be read without their labels. A list of what did not work turned out to be as useful as the list of what did, provided each entry records why.
Listen to the people who will use it
The most valuable measurements came from the client's own authors. They reviewed early drafts in detail, and their comments became the defect key described earlier, so every later change was judged against what the authors had asked for rather than against our own sense of what better meant.
One example shows why that mattered. The authors had asked for the customer outcomes the regulator assesses to run through every document. The agent took that too literally and restated the same outcome in 25 to 30 of 42 sections, while the authors' own submission did so in 2 of 41. Removing the outcomes would have broken a genuine requirement. The fix was about placement, stating the outcome fully where the guidance expects it and referring to it briefly elsewhere, and the defect key told us when we had got it right.
Iterate in waves
We worked in waves. Each wave began with a short plan that said what would change, what result would count as success and which runs would decide it, all written down before any run was made. Then came the change, the runs and the reading. When an experiment failed, we did not simply switch it off. We found which stage caused the failure, added a measurement there if the records could not already explain it, fixed what the measurement pointed to and read the result again. Decisions the runs settled were written into the agent's defaults in the same change and measured again, and every change was checked on more than one kind of document, so that we were improving the agent rather than tuning it to a single example.
What it gave us
The result is an agent whose progress we can show rather than assert. Every draft carries its level on the ladder, the reason it is not higher and a list of exactly what evidence is missing. When the authors supply that evidence and run it again, the next draft can be measured against the last.
This matters to anyone putting an AI tool in front of people whose names go on the output, because a tool that cannot show it is improving will sooner or later be trusted for the wrong reasons. If you are building something similar, these are the habits we would start with.
Write down what good looks like, as levels a draft can be placed on, before tuning anything further.
Run unchanged code several times, learn how much the result moves on its own, and ignore any change smaller than that.
Test your automated reviewers against people before trusting them.
Report every count together with what the check was able to see.
Turn your users' feedback into named defects, and judge every change against them.
Verify the delivered document, not the system's own account of what it did.